Excel is for reporters, not just accountants.
By Maggie Lee, April 27, 2017
Register here with the Atlanta Press Club
We're going to use three data sets. Come ready with Excel or Google Sheets.
Go ahead and download these. The first one will take a few minutes to open in Google Sheets.
 |
Better living for reporters through Excel |
Why use spreadsheets? |
|
 |
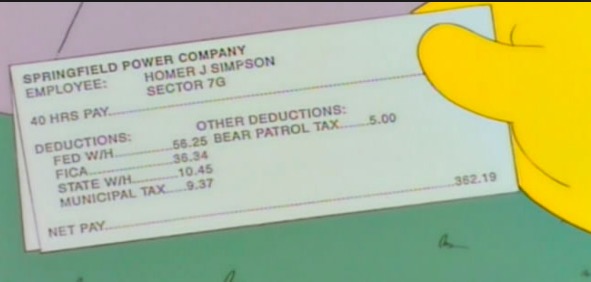
Excel isn't just for accountants. It's for everybody, including reporters. Data is like a tipster. We'll see how you can get story ideas. Who's the highest-paid state employee? How many crimes do cops work at Lenox versus Wal-Mart versus Target? Now for sure, after you interview the data, you still need to interview humans who know what's going on. For example, an otherwise very useful APD data set implies at first glance that there were 107 homicides in Atlanta last year. But there weren't. So we're also going to talk about red flags in data. Here are some stories where I guarantee you they used a spreadsheet. |
 |
More and more places are publishing spreadshets! Look for little links that say stuff like "download Excel" or "download .csv" or "download data."
|
What kind of file can I open and what's in there? |
|
 |
Excel can open .xls, .xlsx, .csv, .txt, sometimes html tables and some others. I'm not going to go through all those. But keep in mind you can open some exotic filetypes, and you can Google that. "How do I open a .txt file in Excel?" You might need to file > import. Any of those files might all be in a .zip file, a compressed file. That's OK, your computer can uncompress it. Google Sheets is a free alternative to Excel; it's in your Gmail account. It does pretty much everything that Excel will in this presentation. Google Sheets is slower though. |
 |
A spreadsheet is just a table or a log. A table with calculating and sorting powers. We're going to start with this slightly modified* state employee salary data set for 2016. Which is right here. |
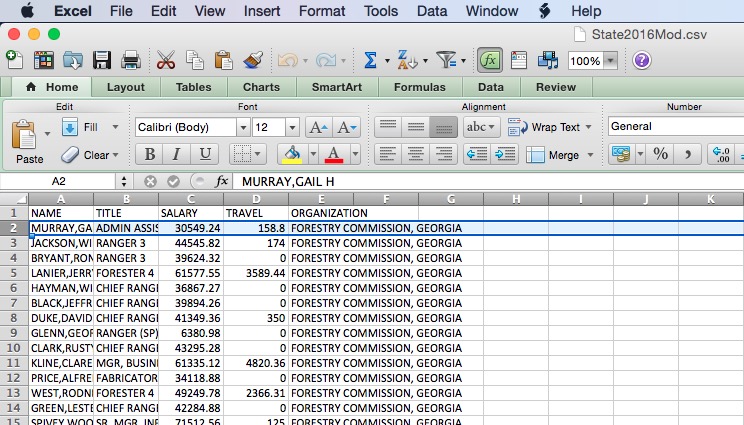 |
The top row is the column names. Click anywhere in this and you can slide around with the sliders or the mouse. You scroll down and the first irritating thing that happens is the column names disappear. That's the first thing we'll fix. Right now. Click on the "2" over at the left. The whole row highlights. Then slide up to Window > Freeze Panes. Then try scrolling down. |
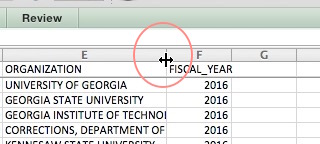 |
OK you can't see the full names or titles. Let's widen some of these columns. Hover on the line between two letters way at the top above your header row. When you get the two-sided arrow, click and drag. |
 |
Obviously the first thing you want to do is see who is the highest-paid employeee. So let's SORT by salary. Click anywhere in the sheet and go to Data > Sort. Look up in the top right, make sure there's a check beside "My list has headers." Then tell it you want to sort by salary. |
 |
The ports director made nearly $2 million? Yes and no. Here's the first data reality check. He made $2 million the year he left, once you count salary, bonuses, pensions and other fees. The AJC did the reporting on that. |
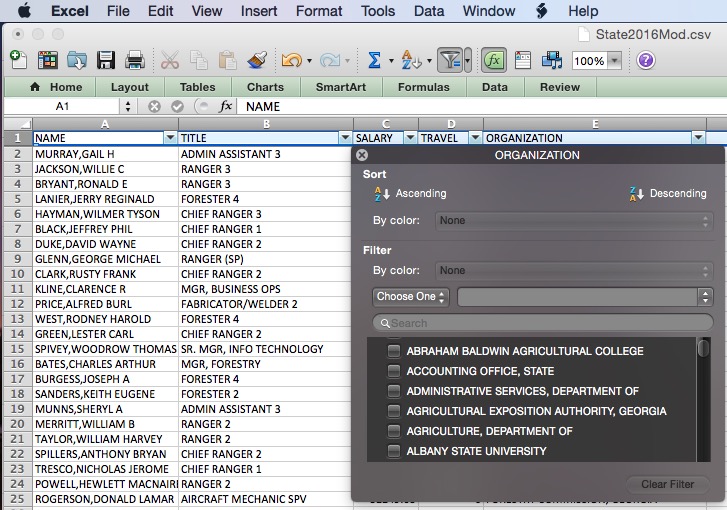 |
Let's say I just want to look at salaries in the governor's office. Let's FILTER by organization. Click anywhere in the sheet and go to Data > Filter. That gives you a bunch of drop-down arrows. Try the little arrow by "organziation." Uncheck "Select All" ... so nothing's selected. Then scroll down to Governor, Office of The. Just check "Governor, Office of The" And where is the Governor himself? You can "find" the word "Deal." Go under Edit > Find. Or, depending on your version, use crtl + F or the search box in the top right. To clear the filter, click the dropdown menu again and click "Clear Filter." |
 |
Then obviously you want to see who is the highest-paid coach. Clear out all the filters, then just filter by title "coach." If you have a late enough version of Excel, there's a little search box. Search for "coach" and it will pick up like "coach" and "assistant coach," etc. WAIT ISN'T UGA'S HEAD FOOTBALL COACH PAID MORE THAN THIS?? Of course. In this high-profile case, spidey sense and a quick Google search reveals he makes more than this. This data is for FY2016, the year beginning July 1, 2015. So (1) it doesn't cover a full year of his salary. And (2) check with the sports desk on this, but maybe is some of his salary paid by like a foundation or something? Maybe not a straight-up state paycheck? This is something you'd have to check out via reporting. |
 |
Other fun filters can include titles like "excutive director" or organzations like whatever state agency you are covering. And although it doesn't include phone numbers, it's also something of a handy employee directory. |
 |
Clear out all the filters though, and here's why you should spend some time interrogating the data: Sort by salary lowest-to-highest. Negative salaries? So those negative salaries and some $0 salaries are a bit of a red flag. Some are board members who don't get salaries, OK, so that's explicable. And some names, for some reason, are entered twice, once for salary and once for travel. |
 |
But does all this strange data mean the data set is unreliable? Well, let's go to the end to see how many records there are altogether. Pro tip: it will take you a long time to scroll. Use a keyboard shortcut to scroll. It will vary by computer and program and version. Mine is crtl + fn + right arrow. Yours may be crtl + down arrow. You may have to Google your shortcut. Anyway we have 207,572 records. Of which about 2,300 have negative or $0 salaries. And of those, some are understandable, like board members earning $0. And others might be understandable if we asked about them. |
 |
So, IMHO this is a pretty good 40,000-foot view of salaries, though all of it requires a reality check. It also gives us an idea that in FY 16, "some 207,572" people worked for the state for at least some time. That includes folks from student assistants at colleges to the governor (but it doesn't include K-12 teachers as state employees, which it arguably could.) Any other story ideas you see in it? But it's only a tipsheet. The first time you visit open.georgia.gov to get this data, you have to click "OK" on a note from the state auditor in which he says he's just collecting the data in accordance with Georgia law and does not express an opinion or any other form of assurance on it. Indeed, if the data were really faulty and crummy, that itself could be a story. The government tracks a lot of things. Aren't there some data sets out there that would be a story if you found a lot of faults in them? :) |
 |
But despite the need for reality checks, "sort" and "filter" can give us some insights. But for summing and grouping, let's look at PivotTables. |
Insights & Falsehoods from PivotTables |
|
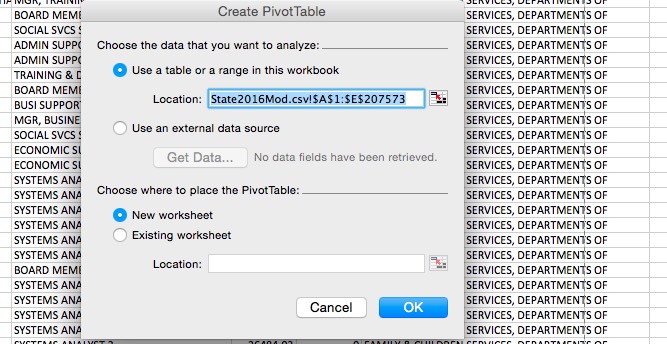 |
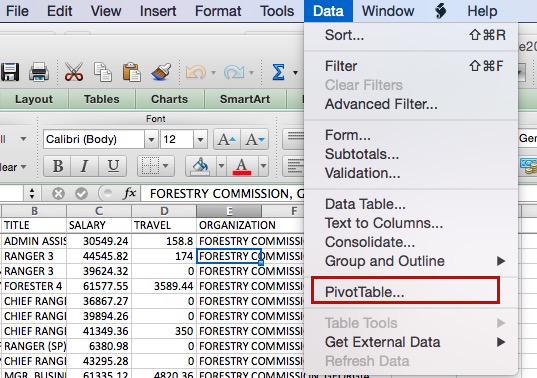
A PivotTable is going to sum and count things for you. For example, we know salaries can get pretty high at Augusta University. What's its total payroll? Click anywhere in the table and go to Data > PivotTable It gives you a cryptic popup. It's asking, "What all data do you want to look at here?" The good news: It's generally by default correct because it assumes "all the data." The explanation of the good news: "State2016Mod.csv!$A$1:$E$207573.csv" means "top left to bottom right," as in the picture over there. So click "OK." |
 |
Don't worry if your Excel looks different from mine. (In Google Sheets, you'll get check boxes, not click-and-drag boxes.) Whatever yours looks like, try clicking & dragging "organization" into "row labels." Then click and drag the word "salary" into "values." |
 |
We're saying: "For every organzation, SUM the salaries." My version defaults to "sum." If yours doesnt, you can change it. Where/how you change it may differ. Mine is this little "i" button. So you're looking at sum of salaries by institution. You can also sort that. Click anywhere in the salaries column and go to Data > Sort. And scroll to the bottom for a Grand Total. |
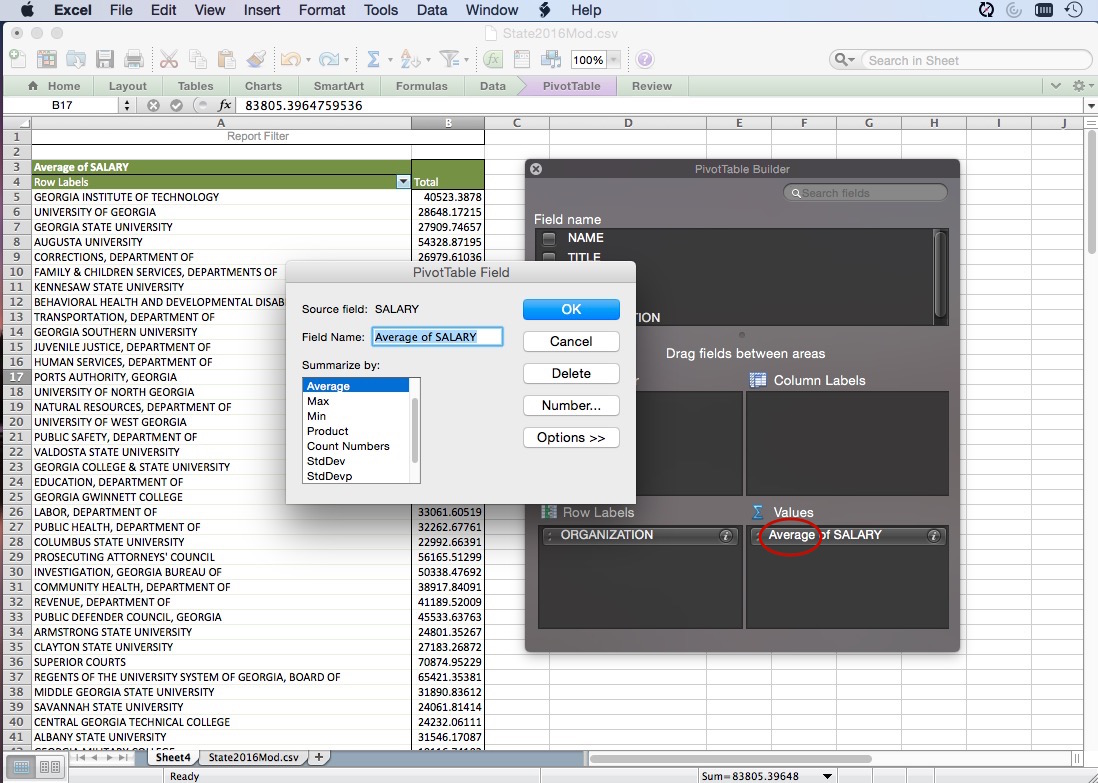 |
You can look at other things like say, average salary by organization. On my version, I'm going to use this little "i" button to change "sum" to "average." Hm, average salary is a lot lower at UGA. Do they have more student employees maybe pulling down the average? And sort by average salary if you want to as well. |
 |
So that was a fun data set. We got some story leads on high-paid employees. But eh, the trends weren't so surprising. Pay is pretty high at universities. Let's try another data set, one from the Atlanta Police Department. It's a log of of reports of a handful key crimes for CY 2016. Which is right here So take a minute and scroll through this a little. Definitely freeze the top row to mark it as the header. Then scroll and sort and filter some if you like. Widen some of the columns if you like. |
 |
Now let's put all that in a PivotTable. Make sure all the filters are cleared out and go to Data > PivotTable. Let's see about the numbers of each of these crimes. You'll want to take "UC2 Literal" and drag it down into "row labels," then take and drag it again down into "values," and make sure it's set to "count" of UC2 Literal. Google Sheets note: this function is called "COUNTA," not "COUNT." In English, you're asking it, "How many times to you see the phrase 'AGG ASSAULT' and 'AUTO THEFT' and so on?" Sort then by count. You'll see homicide are the fewest, larceny from vehicle is the most. |
 |
But you'd call APD and double-check before reporting this, right? I hope so because there were not 107 homicides in 2016. There were 111. My hunch is that this data doesn't account for double homicides. I think it just counts each incident as one, even if there were two victims. I'm not sure, you'd have to call APD to talk about that. It doesn't mean the data set is wrong per se. It means it might not be counting excatly what you think it's counting. Hence why you have to call to double-check. |
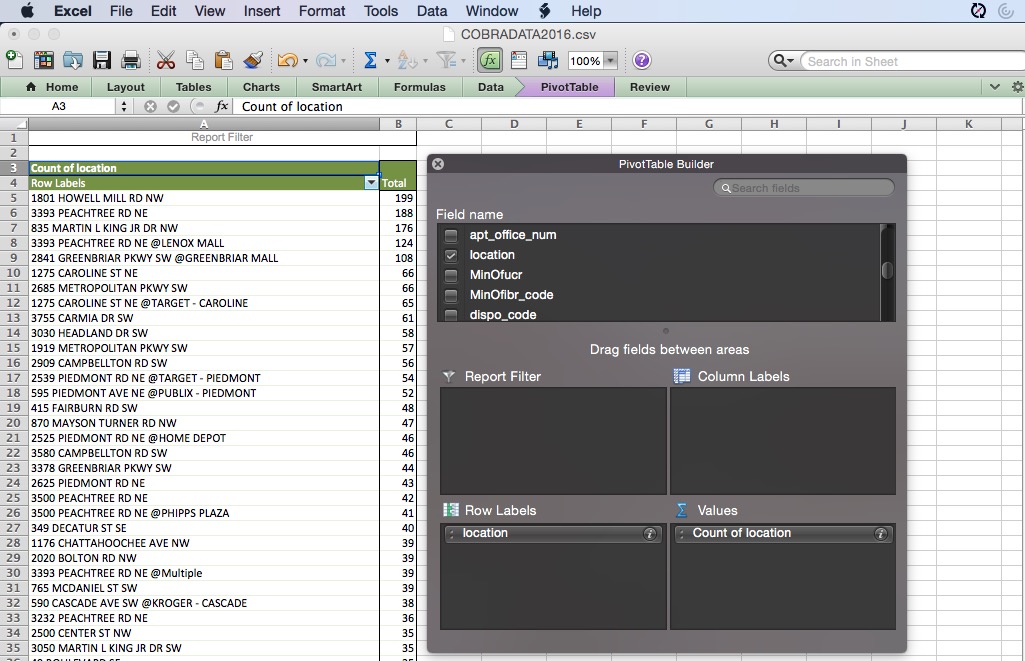 |
But even though you have to double-check the exact numbers, there are some broad trends in there that could mean a story for you. In the end, you might not even report any of these numbers. They might just give you an idea. Go back to that PivotTable and try to find the address associated with the most crimes. You'd want row labels to be "LOCATION" and the values to be COUNT of location. Or in Google Sheets, you'd want row labels to be "LOCATION" and the values to be COUNTA of location. In Excel, let's sort by that "COUNT" of location by going to data -> sort or clicking the button, etc. In Google Sheets, this operation is a little different. Sort by setting the menu at the right like in this picture. |
 |
Clearly, I'm no crime reporter ... But I wasn't thinking of Wal-Mart and Lenox and Target being such hotbeds of crime. Now I know. Let's check out the types of crime. Click UC2 Literal and drag it down to "Row Labels." A lot of this larceny non-vehicle is probably stealing from stores. And it doesn't take a genius to figure that folk would go to stores to steal things. But even so, some reporters have looked at different kinds of stores. What they've found — maybe tipped off by data, but definitely confirmed by law enforcement, is that in some places, Wal-Mart requires a disporportionate amount of attention compared to other stores. Let's check different stores here. |
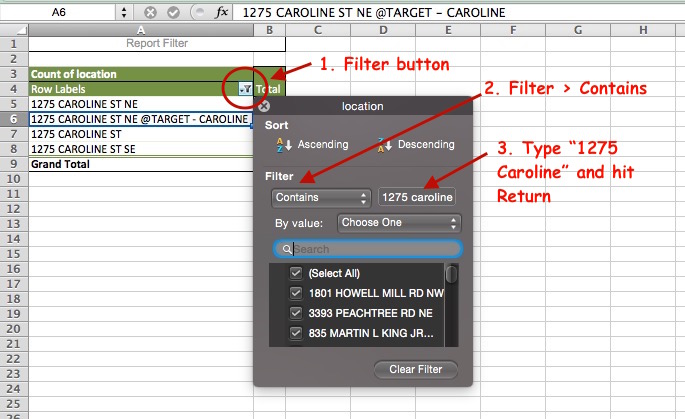 |
First, click and drag UC2 Literal out of "Row Labels." We don't need it just this second. We know that these crimes are heavily weighted toward larceny non-vehicle. Next, let's FILTER so we're just looking at 1275 Caroline Street, a Target. See that button that's like a funnel? Click that, then go to Filter > Contains and in the box, type "1275 Caroline" and hit return. A human knows "1275 CAROLINE ST NE @ TARGET - CAROLINE" is the same as "1275 CAROLINE ST NE" and so on. But a computer doesn't. So you have to ask it for all the addresses that contain the basic part, "1275 Caroline." Including the really maddening one that's "1275 Caroline" -- two spaces in between! There are 139 crimes associated with that address. |
 |
Try the same for other addresses, 1801 Howell Mill, 835 Martin Luther King, 3393 Peachtree: two Wal-Marts and Lenox. You'll get 210, 203 and 405, I hope.
To see the whole shopping center, you have to get creative. Try filtering by just "Caroline." That'll pick up the Kroger in that shopping center and other addresses. You'll have to check maps to see which are and are not in that shopping center. |
 |
And of course if you want to see the crime details by address, just drag UC2 Literal back down to "Row Labels." |
 |
So yea, now with this, shopping centers have the "most" crime according to "data." Which, OK, one could make a screaming headline about DANGER LOOMS at shopping centers. But a cooler result, IMHO, is reporters looking into data just like this, seeing stuff that seemed a little weird, and asking police about it, digging in. Bloomberg found several Wal-Marts with not just tons of shoplifting, but a troubling amount of violent crime too and plenty of police and local officials who complain about the world's biggest retailer skimping on security. But they also get nuanced: is a 24-hour Wal-Mart strictly comparable to a Target that closes at night? Macon's WMAZ looked at Bibb County's 911 call log.They found that three Wal-Marts generated more than five times as many calls to deputies than four other sites — two Krogers, a mall and a Target — combined. The comments from the sheriff don't address any differences among stores, but he said that certain places are sometimes a draw for criminals. And note, both of these stories quote broadly round numbers, "about 5,000 calls," etc. Becasue data sets are just a 40,000-foot view. You still have to get to the ground to see the real details. |
Finally, math! |
|
 |
Let's try calculating some data now. Start with some county-by-county presidental vote tally from last year, which is right here |
 |
We're going to see what percent of the vote each candidate took in each county. Take Appling County. Trump got 5,494 votes. What percent of the total did he get? Trump votes divided by total votes. First thing we need are total votes in each county. |
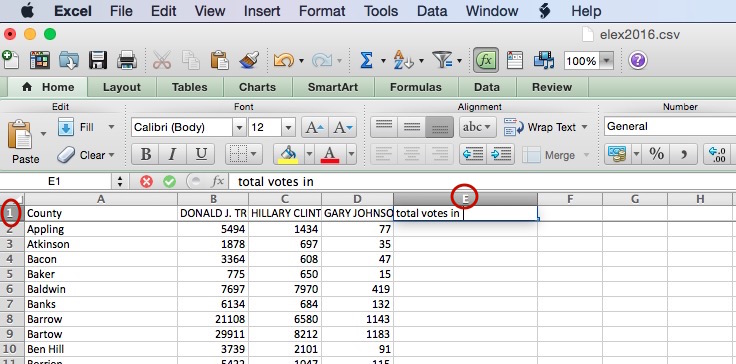 |
Make a new column for the total. Click in cell E1 and type "total votes in county." Take Appling County. Trump got 5,494 votes. What percent of the total did he get? First you need the total number of votes in the county. |
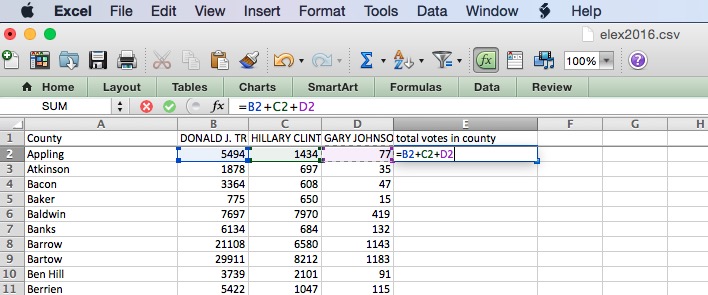 |
Click in cell E2, where you want to see the Appling County total. Type in this cryptic formula: =B2+C2+D2 And hit "enter." VOILA! |
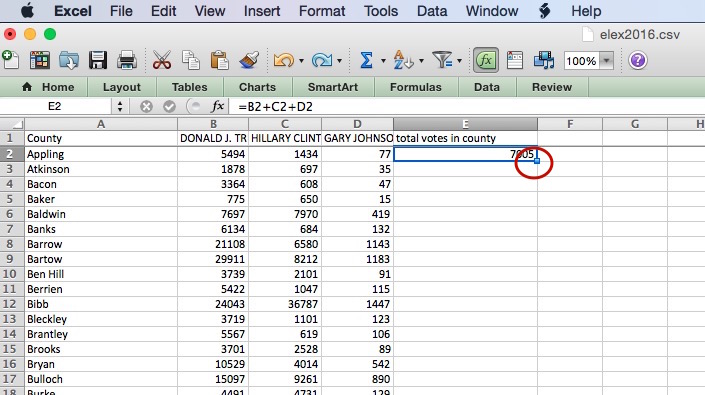 |
Now for the other 158 counties? Click in cell E2. The cell will get highlighted and a little square or "handle" will appear in the bottom right corner. Click that handle and drag downward. |
 |
Now click in one of those cells you just filled in, say E7. E7 says 6,950. But check out the "formula bar." It tells you the math it's doing to come up with that number: =B7+C7+D7 It understands the pattern you set when you typed the formula and dragged it down: "in every row, add the numbers from columns B, C and D." |
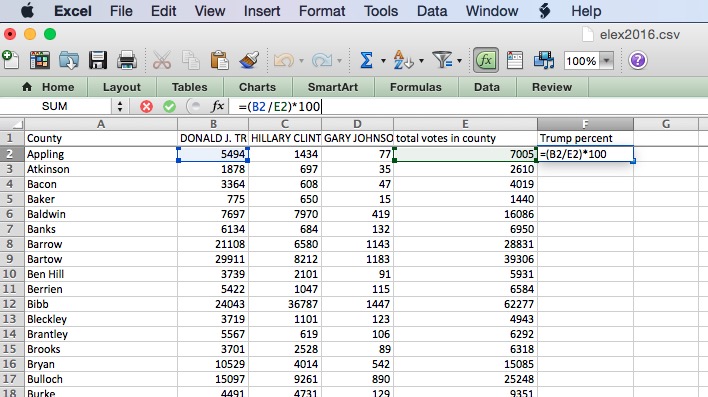 |
Now as for that Trump percentage... Call cell F1 "Trump percent." Then in cell F2, here's your cryptic formula to type: =(B2/E2)*100 You're saying: "Take Trump's total, divide it by the total number of votes, then multiply the result by 100." * asterisk is the spreadsheet symbol for multiply. Drag that formula down too. |
 |
You can make columns for Clinton and Johnson percents. You can sort by those calculated columns. Where did Johnson get the highest percent of votes? |
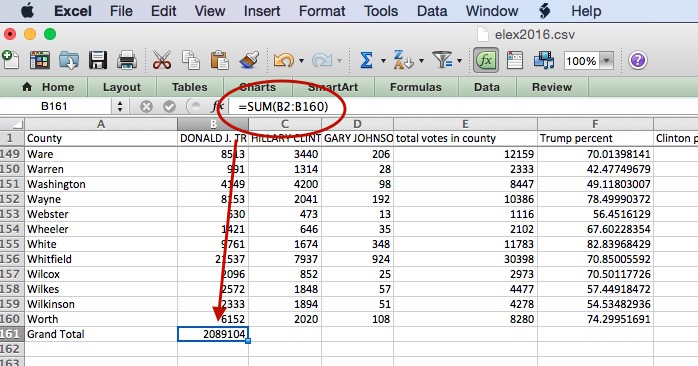 |
What is the grand total of votes that each candidate got? Let's add a new row at the bottom to say. Go to cell A161 and call the new row "Grand Total." In cell B161, put this formula: =SUM(B2:B160) You're telling it: "Sum up everything between B2 and B160." Excel gets the idea that you mean the column. You know what? Then you can click B161, click its handle and drag that formula sideways to get sums for Clinton and Johnson and total votes in county too! |
 |
Let's go through one more way to get story ideas from numbers: let's make a graph. This graph isn't going to be pretty enough for publication. It's just an additional way to search for "aha" things in data. We're going to graph Clinton's and Trump's vote percentages by county. |
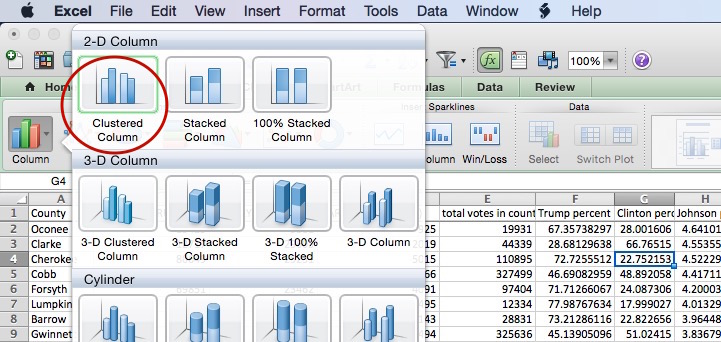 |
Click anywhere in the data and in Excel, go to Insert > Chart. Don't panic if yours looks different. It probably will. That's OK. Whatever you see, the first thing you need to do is pick a type of chart. Look for "clustered column." We're going to graph Clinton's and Trump's vote percentages by county. |
 |
Now, your program is trying to guess what data you want graphed. The default is wrong here. Excel is guessing you want to graph "everything." But no, we only want three columns: County, Trump percent and Clinton percent. Click on the little handles and adjust them so that only those three columns are highlighted. Scroll to the bottom and also exclude the "Grand Total" row. We didn't calculate statewide percents, it won't be part of this graph. Google Sheets: GS will also incorrectly guess that you want to graph the whole data set. You'll have to do the same thing: tell it which columns you actually want to graph. On the chart types tab, click the grid pictured here. It will ask you which ranges you want to add. You can add columns A, F and G there. |
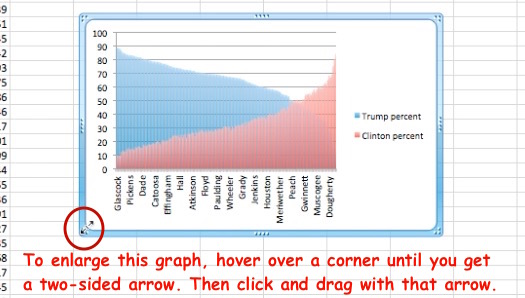 |
The default graph is kind of a mess huh, doesn't show us much. First, the data is not in a useful order. It's still sorted by Johnson's percent. Let's sort by Clinton or Trump. Just click in the spreadsheet and sort like we've been doing. The picture will resort as the data does. Then strech out the graph so you can see it a little better. Hover over the corner of the graph and when you get a two-sided arrow, click and drag that arrow. |
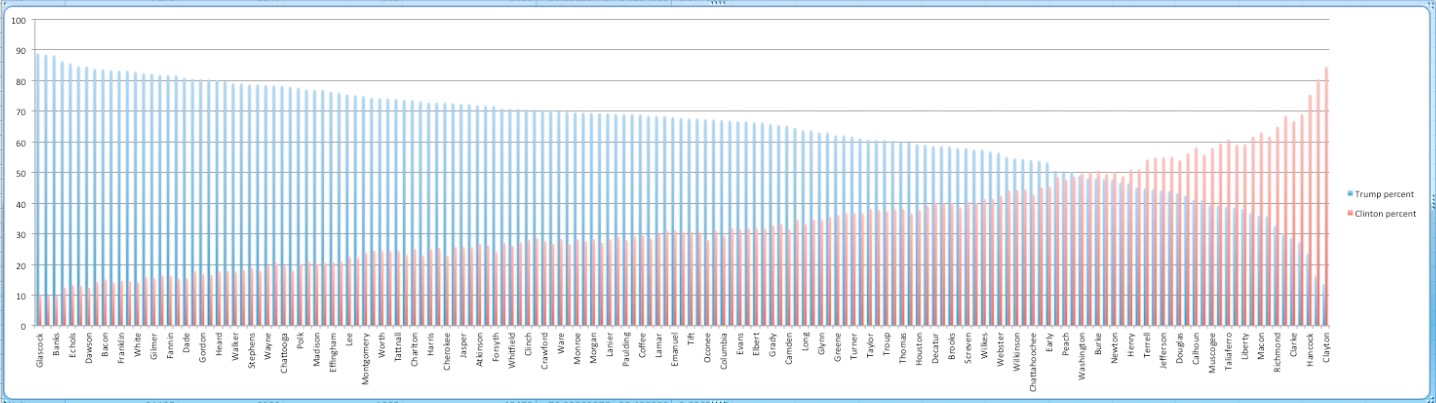 |
And voila. You have a graph that's not pretty enough for publication, but it does show you at a glance where the margin between the candidates was the biggest and the smallest. Google Sheets: to be able to click on a bar and see the Trump percent and the Clinton percent, click the eyeball button to the right of the chart. That takes you out of edit mode and into viewer mode. |
Stirring Conclusion |
|
 |
There are plenty of errors and troubles and the internet has the answer to them all. Linked here are some quick ones. |
 |
Here are videos of everything we've done here. |
Sincere apologies to idewords, author of The Website Obesity Crisis, for my lifting this lovey lightweight layout.
*For this exercise I took the state data set and 1) cut out PreK-12 school system employees so that the spreadsheet is short enough to be opened in Google Sheets. The original data set is something like ~500k lines. 2) I also corrected some formatting that caused some lotto employee salaries to not display on the same row as employee name.